
Brief Description of Resource
This resource leverages NPR’s “School Money” interactive map to help students explore and understand the significant disparities in school funding across the United States. Students will collect and analyze data on per-student spending to gain insights into how these disparities impact educational equity and opportunities. They will use ChatGPT to compile, organize, visualize, and analyze this data to gain a deeper understanding of central tendency measures and their real-world applications on public policy and social justice.
Instructions for Use/Implementation
- Introduction: How does the amount of money spent on a student’s education affect their learning opportunities and future success? We will begin with a brief discussion around this question to encourage students to share their thoughts and experiences. This resource is created for a class size of 25 students or fewer.
- Drawing on previous learning: Using Mentimeter, the facilitator will conduct a quick poll with the following questions: (1) Do you think all schools in the U.S. receive the same amount of funding per student? (2) What factors do you think influence the amount of funding a school receives?
- Brief Overview: Before coming to class, students will have read: (1) What research says about unequal funding by Biddle & Berliner (2003) and (2) From the Achievement Gap to the Education Debt by Ladson-Billings (2006). They will share key concepts and insights and then we will proceed to explore NPR’s “School Money” series as a resource for understanding these disparities.
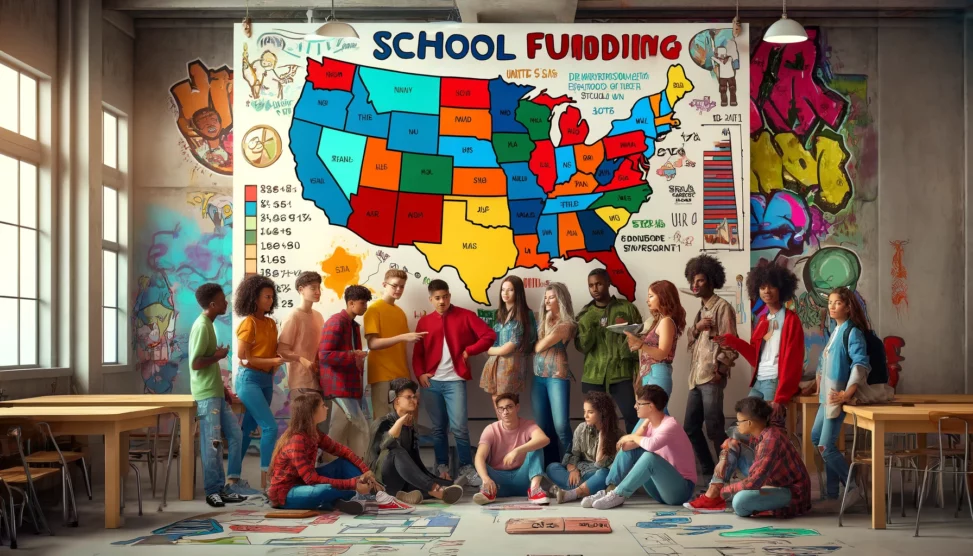
- Exploring and understanding the Interactive Map: What does the interactive map show about school funding across different states? How is the data on school funding displayed? (color coding, numerical values). Students will spend 10 minutes perusing the NPR School Money interactive map to understand how it works and how they can collect data from it.
- Data Collection: What is the minimum, maximum, and average spending per student for your assigned states? Are there noticeable differences in funding between your assigned state and its neighboring states?
Data Collection Template
Name:
Assigned States:
Map Exploration
Describe what the interactive map displays and how to navigate it:
Data Collection for State 1:
State Name: ___________________________
Minimum Spending per Student: _______________
Maximum Spending per Student: _______________
Average Spending per Student: _______________
Data Collection for State 2:
State Name: ___________________________
Minimum Spending per Student: _______________
Maximum Spending per Student: _______________
Average Spending per Student: _______________
Comparison and Analysis
How do your assigned states compare to the national average?
What patterns or trends in the data do you see across different regions?
Impact of Funding Disparities
How do the differences in funding impact students’ educational experiences?
What are potential reasons for these funding disparities?
- Data Compilation: The facilitator will ask students to create a free account in ChatGPT if they don’t have one yet. They will offer a short explanation of how it works and will ask other students who have used it to share their insights. Students will use ChatGPT to collaboratively create a table with four columns: State, Minimum Spending, Mean Spending, and Maximum Spending.
Work in pairs
- Visualization: Students will use ChatGPT to generate a code to draw a histogram and a box plot of the collected data in R or other programing language. The facilitator will support students in the creation of the prompt and verifying that students’ codes are working.
- Discussion 1: Students and facilitator will spend 15 minutes discussing how funding is allocated, and how mean, median and distribution offer different perspectives of the data. Guiding questions: (1) What do the terms mean and median mean in the context of school funding? (2) How do the minimum, maximum, and average spending help us understand the distribution of school funding? (3) What might be some reasons for the large differences in school funding between states? (4) How can the way we present data (e.g., tables, interactive map, histograms, box plots) influence our understanding of funding disparities?
- Use of AI: Students will develop prompts to ask ChatGPT to ask it how it would analyze the data, and then will compare with their own answers. Example of a prompt: Please, help me analyze the school funding data for State X and State Y? What insights can you provide about the differences in their minimum, maximum, and mean spending per student?
- Discussion 2: Students will share their prompts and responses from ChatGPT and discuss the implications of using AI as a research tool. Guidingquestions: (1) How accurate do you think ChatGPT’s analysis was compared to your own? (2) What are the benefits of using AI tools like ChatGPT in data analysis? (3) What are some potential limitations or challenges of relying on AI for research?
AI Tool Used
Students will use ChatGPT for data compilation, creating tables, and generating codes to generate histograms and box plots in R, and analyze data.
Prep Time Needed
30 minutes
Classroom Time Needed
1 hour and a half
Student Learning Outcomes
- Understand school funding disparities: Students will learn how school funding varies across states and districts.
- Understand central tendency measures: Students will differentiate between mean, and median, and understand their use in skewed data distributions.
- Develop critical thinking: Students will analyze how statistical measures can provide insights into social phenomena.
- ChatGPT Literacy: Learn how to use ChatGPT to create tables, generate code for graphing in R or other programing languages, analyze data.
- Explore other students’ perspectives on the use of AI tools in research.
Assessment Considerations
- Individual Reflection: Students will reflect on (1) the use of ChatGPT in this activity, (2) the difference between mean and median, and (3) their findings and the implications of funding disparities in the U.S.
- Class Discussions: We will facilitate a conversation with the whole class on the three themes described in the individual reflection.
Recommended Course Size
This activity is thought for 25 students or less, however, for larger groups, the class can be split into smaller groups for data collection and analysis.
Recommended Discipline(s)
Social Studies: High school level courses exploring statistics, social justice and public policy.
Statistics: Undergraduate courses focusing on central tendency and data analysis.
Education: Undergraduate or graduate courses examining educational policy and funding.
Student Role(s)
Data Collectors: Students will gather data from the interactive map.
Researchers: Analyze and interpret data using AI tools.
Collaborators: Work together to compile and visualize data.
Instructor Role
Facilitator: Guide students through data collection and analysis.
Support Provider: Assist with technical issues and conceptual understanding.
Discussion Leader: Encourage critical thinking and in-depth discussion about school funding disparities and statistical measures.